Robust Reporting and Timely Tracking with Learning Management Systems (LMS) Analytics
Track your training ROI with robust and configurable reporting dashboards.
Request a DemoMake Data-Driven Decisions
Track and boost employee & customer engagement & performance with data-driven measurement that guides you in delivering ongoing improvements.

Intuitive Reporting
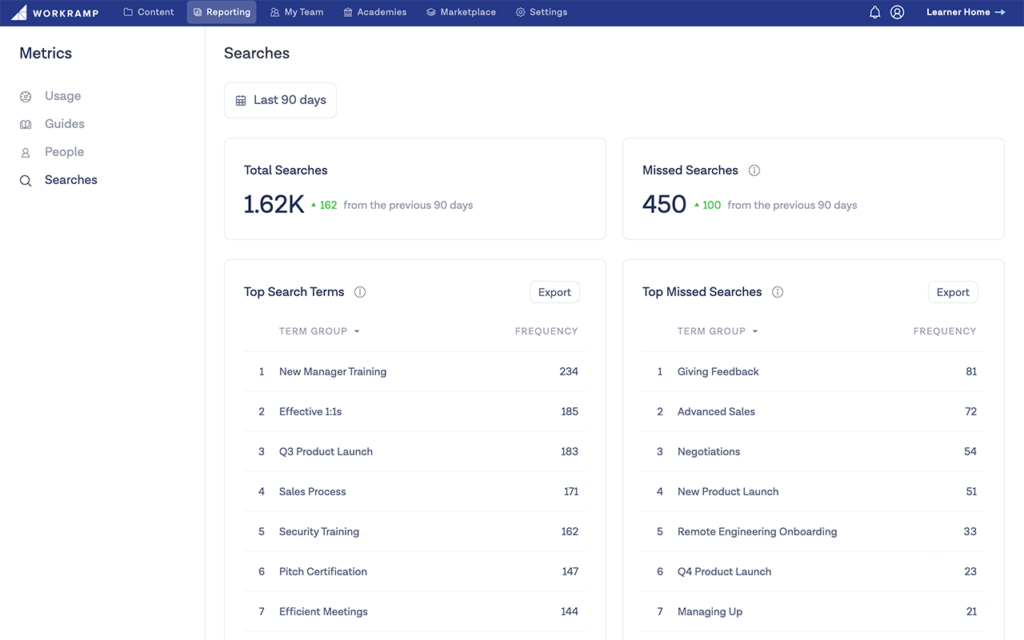
Tap the power of advanced reporting to better analyze trends, measure team performance and track the effectiveness of training programs.

Leverage Our Salesforce Integration
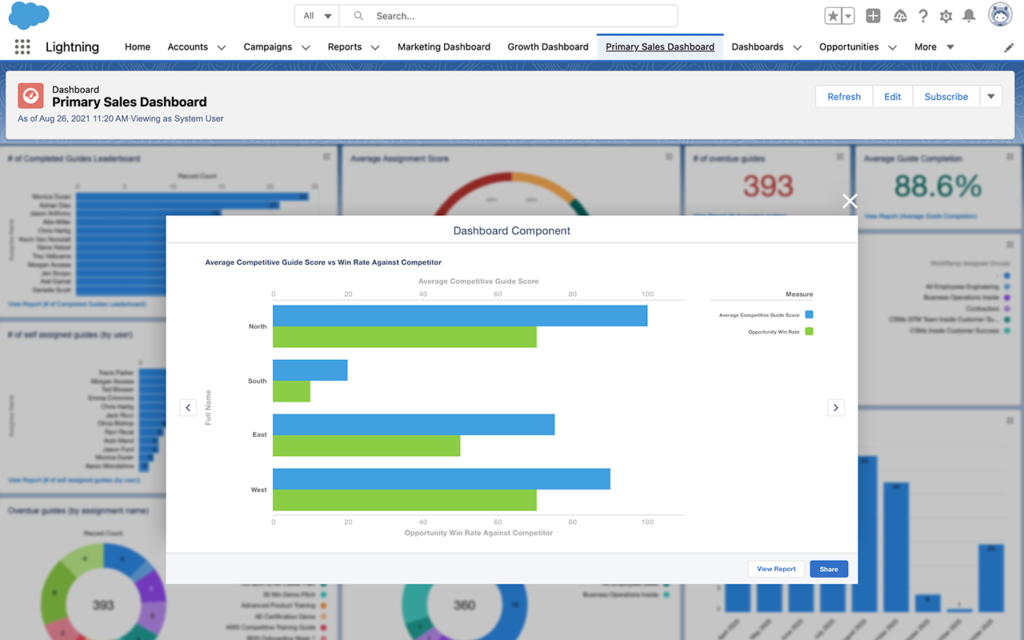
Leverage our Reporting APIs to seamlessly flow training data into other systems. Measure the impact of training on native Salesforce dashboards.
Our Customers
Top global organizations from emerging businesses to Fortune 500 enterprises use WorkRamp to power their corporate learning strategy.
Our Employees
We believe that unleashing human potential - both inside and outside of the company- is the key to success.
Our Social Impact
Workramp.org provides technology, funding and time to help nonprofits expand their impact using learning technologies.
LMS Learning Analytics
According to the 2021 Training Industry Report, training expenditure in the US rose to $92.3 billion in 2020–21. This is a 12% increase as compared to 2019–20. Companies that took part in the survey reported that increasing the effectiveness of their training programs remains the number one priority for them, followed closely by increasing learner usage and measuring the impact of their training investment.
All three of these goals can be measured with LMS learning analytics. LMS learning analytics provide hard data to measure whether your training investment translates to positive experiences for your learners and meaningful business outcomes.
What Is Learning Analytics?
The term ‘analytics’ refers to the process of analyzing data or statistics, as well as the information gathered as a result of that process. Learning analytics refers to the analysis of data related to learner behavior. In learning analytics, we collect and organize metrics related to learner engagement and learning results, such as course completion rate, time spent on a particular course, and performance on a post-course assessment.
Uses of LMS Learning Analytics
L&D, sales enablement and customer education professionals use LMS learning analytics to identify the successful and unsuccessful elements of their training programs and to demonstrate its ROI.
Measure the efficacy of your learning program
Measuring the efficacy of your learning program helps you understand where your training program stands. By doing this, you are trying to find whether your learning program achieved what it was supposed to achieve. Did the learners acquire new skills? Did they use those skills to achieve a business goal? To answer these questions, look for patterns of learner engagement and performance by studying metrics such as course completion rate, assessment scores, and achievement of individual business goals after course completion.
Gain actionable insights to improve your learning program
The most valuable learning analytics go beyond raw data. They point toward opportunities for improvement in your learning program.
For example, learning analytics in your LMS reveal which courses are more popular than others and even identify patterns among your most popular courses. Your analytics may show that a certain course design, duration, or instructor correlates to high engagement. This knowledge will help you improve less popular courses in your LMS.
Determine ROI of your training investment
There are many ways to determine the ROI of your training investment. This can be done by using an ROI calculator, creating a training impact study, and using assessments. With learning analytics, ROI is measured by correlating course completion rates and assessment scores to data like employee retention, company performance, and customer success.
The idea is: if an employee completed a course and did well in the assessment, their newly acquired skills would reflect in their job performance. A sales rep should be able to close more deals after going through sales training; a designer should be able to complete their projects faster; a developer should take less time to code, and so on.
Customers who complete customer education programs should have the tools to know how to use your product and its features effectively. You should see declines in support queries, and an increase in retention rates.
What Metrics Should You Track From LMS Learning Analytics?
The best Learning Management Systems come with native analytics that track metrics such as course completion rates, active learners, course ratings, and instructor ratings. They typically also integrate with Google Analytics, Tag Manager, Facebook Pixel, or similar external analytics tools that allow you to track user activity at a granular level and provide additional metrics to track (such as most clicked buttons and outbound links).
For example, integrating Google Analytics and Google Tag Manager with your LMS gives you the option to create multiple customized dashboards that’ll help you understand the needs of the learners. If your course material contains external links, tracking the most clicked outbound links will tell you which information to add to your LMS so the learners don’t have to leave your ecosystem during the course. Tracking user log off (or time out/inactivity) points will tell you whether the courses are too long, and so on.
There are multiple metrics that can be tracked to gain actionable insights to improve your training program. We have grouped these metrics into four categories based on their impact on individuals and teams.
Learner activity
Learner activity metrics tell you about the overall engagement of your learners. These metrics help you identify your most- and least-engaged learners, assessment scores, and learners that are learning more effectively than others.
| Metrics | What this tells you | Possible course of action |
| Progress, status, completion rates | How much of the course the user has completed. | Set reminder emails to go out at different percentages of completion. Offer incentives or create a competition to complete courses in fewer than x days. |
| Last log in, total time spent training | How often a user logs into the LMS and how much time they spend on different courses. | Set reminder emails to go out if a user does not log in for x days or does not spend the allocated time on training. |
| Learning path progress | How far a learner is in a learning path. | Reach out to the user if learning path progress is slower than expected and find the reasons why. |
| Individual employee assessment/quiz scores and answers, number of answer attempts | Effectiveness of a course in teaching new skills. Quick learners among everyone who took the course. | Award the top performers. Re-evaluate the course if quiz scores were generally low. |
Learner behavior
Unlike learner activity metrics which tell you about user engagement, learner behavior metrics tell you about the learning journey, i.e., where the learners started in terms of skills, where they ended up, and the route they took to get there. So instead of course completion rates, you focus on the type of content consumed.
Learner behavior metrics allow you to explore the needs of your learners by showing how learners interact with pre-determined learning paths. Your standard LMS analytics, as well as integrations with Google Analytics and Facebook Pixel, are useful in measuring these metrics.
Use learner behavior metrics to identify the best content providers/instructors, popular topics of discussion among the learners, topics to include in a particular learning path, changes that need to be made to the course design, and more.
| Metrics | What this tells you | Possible course of action |
| Searches and topics | The most popular topics among learners. | Find out gaps in your training program and add courses that address the top searches by employees. |
| Content providers | Instructors and content creators popular among learners. | Add more content by popular content creators. Use the more popular instructors for live classes. |
| Content consumed | The type of content popular among learners. This means articles, videos, podcasts, and books. | Increase the percentage of the type of content that’s resonating with the learners. |
| Content added by employees | User discussion topics on relevant Slack channels or LMS-supported communities. | Get additional insights on type of content, instructors, etc. Identify learners that are mentoring others. Tap into articles, videos, etc., shared by learners and add them to the training program. |
Effectiveness of training content
Measure the effectiveness of your training content by analyzing metrics such as test scores, performance in virtual labs, job performance after training, NPS scores, retention rates, and similar metrics. These metrics help you understand:
- Whether learners gain new skills through the training content
- Whether they apply those skills effectively
Measuring most of these metrics is possible through built-in LMS analytics. For the rest (such as job performance), integrations can be used.
| Metrics | What this tells you | Possible course of action |
| Average assessment scores (for every individual) | The effectiveness of the training in general. | If the assessment scores are below industry average, re-assess the training material and course design. |
| KPIs related to on-the-job performance (before and after training) at an individual level | Impact of training on business goals, i.e., sales, leads, customer ratings, production. | If people started achieving their goals, give yourself a pat on the back. If the results were below expectations, collect more feedback and suggestions from everyone who completed the training. |
Team-wide impact of training
All the metrics discussed so far measure the impact on training at an individual level. Viewing these stats at a team level will help you measure the net effect of training. Some of the native LMS metrics include total course completion rate, average engagement, and average test scores.
Correlating training with changes in performance at a team level will give you a bird’s-eye view of the impact of your learning program. For example, measure total sales, overall customer feedback,retention rates, and production speed to see whether the sales team, the customer support team, the marketing team, and the development team achieve better results after training.
What’s Next After Identifying Learning Analytics?
Instructional designers can use LMS learning analytics to identify learners that need help and then provide them with training material at their skill level and in the format they prefer.
With LMS learning analytics, you have all the data you need to identify the type of learners enrolled in your learning program by looking at the format of content they are using. For example, visual learners engage with video and image-based content, aural learners with podcasts, kinesthetic learners with virtual labs, and reading and writing learners with articles. Most training programs have content in multiple formats — some use articles with videos, some rely on live training sessions in combination with ebooks, and so on. By identifying different types of learners, L&D and customer education professionals provide them with supplementary training material in their preferred format. As a result, the overall experience for the learners improves drastically as they are able to acquire new knowledge more easily.
Align/Connect Learning Programs and Actual Business Results With WorkRamp
WorkRamp’s learning analytics help you identify patterns and gain insights to transform your training programs. The platform enables you to see patterns in user behavior and gauge learner engagement and satisfaction with the help of data visualization and customized dashboards.
Identify your learners’ needs by seeing what they are searching for, keep track of their progress and assessment scores, and identify their preferred format, course provider, and instructor to create a better experience for them.
Integrate the LMS with your CRM to measure sales, support, and marketing’s performance before and after training, and prove the ROI of your training program by correlating it to individual as well as team productivity and achievement of business outcomes.
The best part? You can gain access to all the data and analytics within the WorkRamp platform and implement changes within the same ecosystem. Find more information on WorkRamp learning analytics here. Complete the form below to get a WorkRamp deep dive with one of our solution experts.
Learn More
Give your employees the best-in-class LMS and improve your training outcomes. Reduce ramp time and churn. Request a demo today.


